
TRADING Central Methodology
TRADING Central is a leading technical analysis provider that combines:
- A chartist approach to assess directional moves and price targets
- Mathematical indicators to confirm initial thoughts and fine tune timings
- Japanese candlesticks to confirm trend reversal or acceleration
TRADING Central methodology uses technical analysis to provide an intraday view (current trading session), short term (up to 3 weeks) view and a medium term (up to 3 months) view on a company.
Quick definitions
Short term view (up to three weeks)
- Rise: (Strong Bull) A strong increase in price
- Limited Rise: (Limited Upside) A limited increase in price
- Consolidation: Movement of an asset's price within a well-defined pattern or barrier of trading levels. Consolidation ends when the price of the asset breaks beyond the restrictive barriers, which triggers a quick increase of volatility (and an opportunity for short-term traders to generate profit)
- Limited Decline: (Limited Downside) A limited drop in price
- Decline: (Strong Bear) A strong drop in price
Medium term view (up to three months)
- Bullish: Asset heading for a period of generally rising prices. Refers to an optimistic outlook
- Range: (Consolidation) Movement of an asset's price within a well-defined pattern or barrier of trading levels. Consolidation ends when the price of the asset breaks beyond the restrictive barriers; it is seen as a bullish (on an upward breakout) or bearish signal (on a downward breakout)
- Bearish: Asset heading for a period of generally falling prices. Refers to an pessimistic outlook
How to read and use TRADING Central reports
Each TRADING Central report comprises on a text analysis and a chart image. Main paragraphs and definitions as seen on TRADING Central reports:
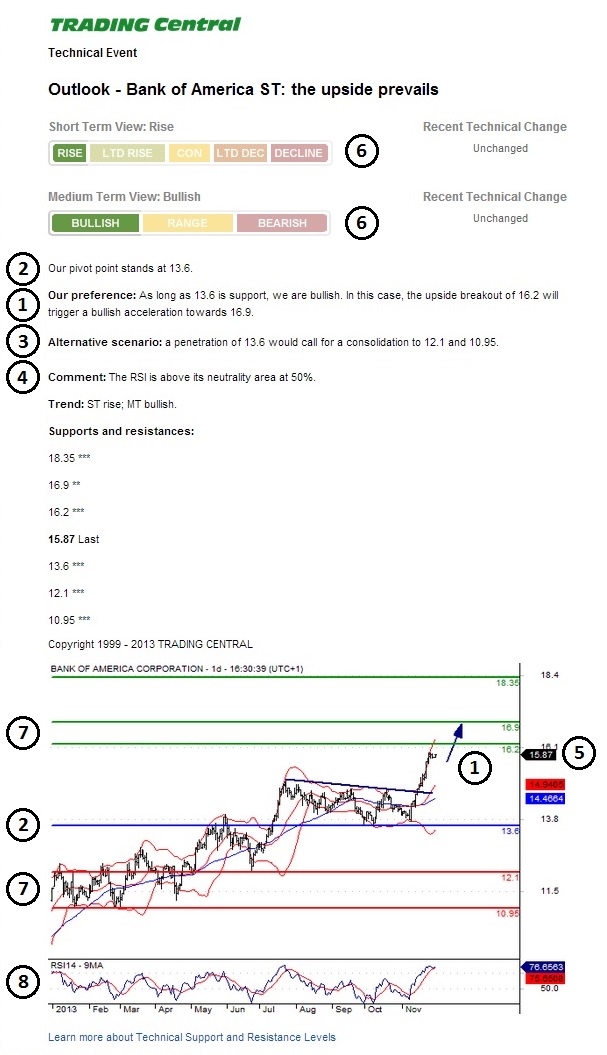
1) "Our preference" on the trend and pivot point. TRADING Central's favored outcome illustrated by the directional arrow on the chart image. TRADING Central usually provides both a conservative target and an aggressive target
2) Pivot (light blue horizontal line): is the key level within every Technical Analysis Report. It is a key technical level (support or resistance), where TRADING Central would turn bullish from bearish, or bearish from bullish.
3) An alternative scenario that should be followed if the pivot point is broken, below/above which TRADING Central believes there has been a physiological shift in the market.
4) A comment that briefly describes the arguments underlying the strategy and how TRADING Central formed its opinion.
5) The price when the report was produced
6) The ST and MT trend summarizes TRADING Central's opinion and is Short Term (ST) over one week horizon or the Medium Term (MT) over one month horizon.
7) Supports (red) and resistances (green horizontal line): key levels where liquidity is concentrated and which may act as price targets on the down or upside.
8) Technical indicators below the price chart such as RSI and MACD
Indicators Definitions
MA (50) & MA (20): The most simple trend indicators are Moving Averages. They simply correspond to an average calculated on an evolving time scale (20 and 50 periods): every day, the oldest value (often taken at the close) in the average calculus is replaced by the value of the new session.
Bollinger bands: are represented by 3 different bands and are derived from moving averages. The middle band corresponds to a simple moving average (MA (20)). The level of the upper band, in every point, corresponds to the sum of the level of the middle band and twice the value of the standard deviation associated to the 20-day moving average. Reciprocally, the level of the lower band corresponds to the level of the middle band diminished by twice the value of the standard deviation associated to the 20-day moving average. An envelope of the future price is thus determined. This makes it possible to then identify the variation margin in which the future should stay almost systematically. In the case of a future following a Gauss law, 95% of the trades will thus occur between these bands.
RSI (14): the Relative Strength Index aims at establishing a reference scale independently from the future price levels themselves. As the RSI has boundaries (0 and 100), it then becomes very easy to determine overbought (above 70) and oversold (below 30) areas. In addition, just as on prices themselves, supports and resistances can appear, especially when nearing the neutrality zone (near 50). Thus, the RSI is one of the most commonly used counter-trend indicators. It is based on the average of rises and drops of price, with the formula: RSI = 100 - [100 / (1 + RS)].
Where RS represents the average of up closes divided by the average of down closes on the considered period (14).
By "Pivot Point" we at TRADING Central mean a pivotal point, a key technical level - analogous to a trading stop loss level. It is synonymous to "key technical level" - it can be anything from a Fibonacci projection to a gap, etc. Actually, there is no one-way for calculating an invalidation level. We favor the use of Fibonacci levels (either via a retracement or a projection), along with classical technical levels (gaps, horizontal lines, etc.). The choice will depend on the current market configuration. A break through our invalidation level would invalidate our forecast, mentioned as "Our Preference" and trigger the "Alternative scenario".
Founded in 1999, TRADING Central has become a global benchmark in technical analysis research. Our content is available on Bloomberg, Refinitiv, Dow Jones, leading trading software, mobile apps and financial portals reaching out to millions of professional and retail investors, in 26 languages. A Registered Investment Advisor with the SEC, the SFC and AMF compliant, a Certified Member of Investorside, EuroIRP, AsiaIRP, the firm is committed to align its research with investors' interests.
The TRADING Central Research Team is comprised of Senior Technical Analysts with STA, MsTA or CMT qualifications. They cover global asset classes (equities, fixed income, currencies, commodities) 24 hours a day from our New York, London, Paris and Hong Kong locations. They are often quoted in the world financial press and invited to speak at leading public events
Coverage
Approximately 3,000 stocks actively traded on the NYSE, AMEX and NASDAQ, including common stocks, ETFs and ADRs.
What's Provided on Fidelity.com
Individual stock research reports, updated at least weekly. Each report consists of the following:
- Clear directional scenario with price targets
- Stop loss level and alternative scenario
- Graphical indicators and technical oscillators commentary
- Short-term and mid-term trend overview
- Details on significance of key supports & resistance levels
- TRADING Central's in-house charts to illustrate the analysis